6 Things to Consider when Building a Dataset from Scratch
This post is about my experiences at the Digital Humanities Summer Institute (DHSI) held at the University of Victoria, June 5-10 2013.
Last month I attended my first DHSI on UVic’s idyllic campus. In just five days I became proficient in the notoriously difficult ArcGIS; moved my research several, big steps forward; and met some wonderful folks working on amazing projects.
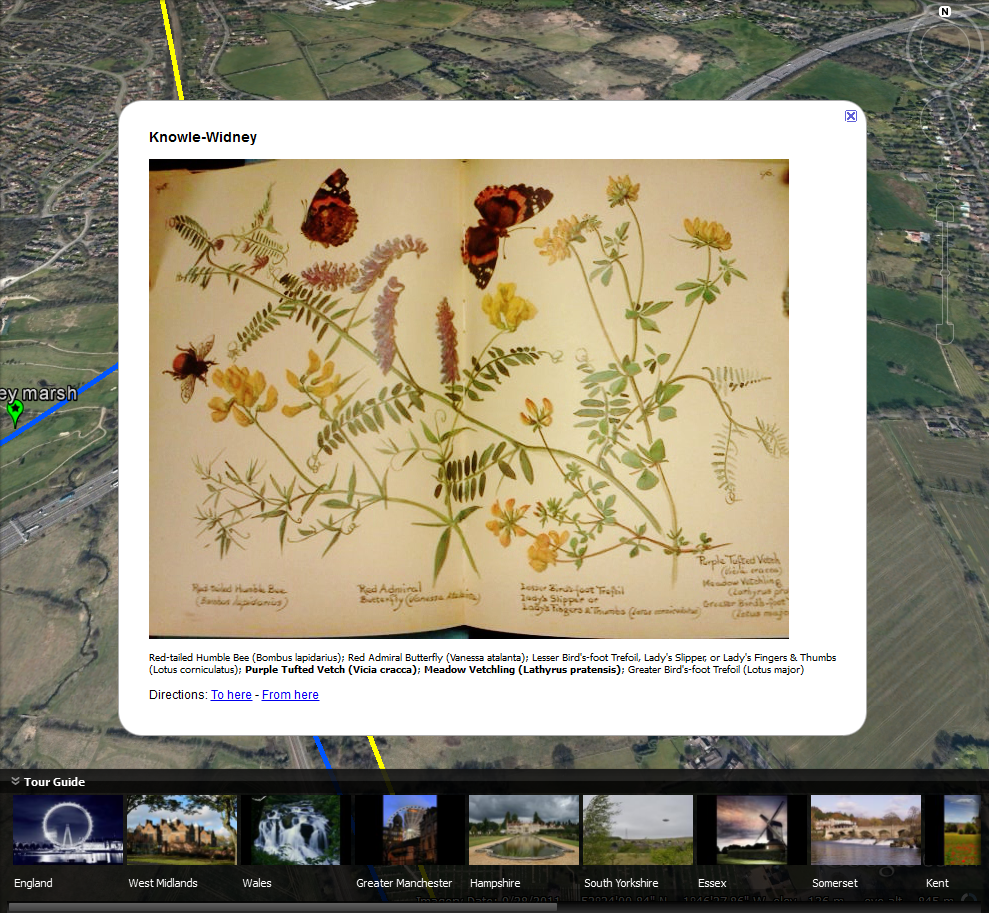
The course I was enrolled in, “Geographical Information Systems (GIS) in the Digital Humanities,” asked attendees to bring their own data. Being a DH newbie, I had no idea what kind of data was out there or how to find it. I exchanged a few emails and then met with my university’s newly hired GIS expert about where to find data on my topic. She had some excellent recommendations for providing historical context data (UK Met Office for weather, Botanical Society of the British Isles for botany, and Natural England for wildlife populations, to name a few). But when I described my project in detail she looked at me and said, “Well, it sounds like we’re going to need to build your dataset from scratch.” I spent the next month trying to figure out what exactly a dataset really was and how to build one for my research on Edith Holden’s naturalist field books.
Here’s what I learned in the process:
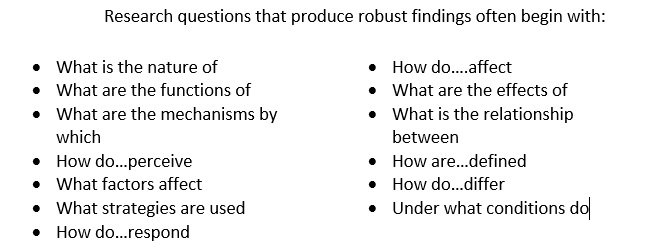
- Shape your research questions first. They may change, in fact they’re almost certain to change once you begin your research. But having a robust research question or set of questions before you begin will help temper the feelings of bewilderment often produced by beginning a dataset from scratch. I find Sonja Foss and William Waters’s list in Destination Dissertation (pg. 41) particularly useful in forming research questions – and so have my students.
- Start simple. When I opened my excel spreadsheet and began creating columns for all the pieces of data I thought I wanted, I ended up with fifteen columns and a near-infinite, horizontal-scrolling problem. It was also taking me far too long to complete the dataset. So I simplified by narrowing my fields down to five, manageable columns: source, date, lat/long, type, and label. As you can see they are relatively basic kinds of information that are easily generalizable to other texts and projects.
- Move beyond your doubts. Cutting back the number of columns was terrifying. What if I missed something important? What if my data wasn’t robust enough? What if it didn’t show me anything new? Would digital humanists scoff at my work? But then I realized that those questions, with a few substitutes, were pretty much the same doubts that I experienced when putting together my dissertation prospectus. They’re the same doubts that plague most graduate students and likely many early-career academics as well. Some of these questions are twisted versions of legitimate concerns academics should ask themselves about their research, but they are rarely useful and almost always harmful in the initial stages of a project. Shelve them for now and return to them (in their un-twisted forms) when you have a better sense of your project.
- Failure can be fruitful. Perhaps even more fruitful in this kind of digital work than in “traditional” research. If your data doesn’t show you something you expect, it will likely show you something unexpected. In other words, the potential for new insights is even greater when working through failures – whether they be failures in the data design, in the data mining, or in the data presentation.
- Don’t be afraid to ask for help. At whatever stages of the research you need it. I may have been stuck worrying that my data design wasn’t elaborate enough to constitute important research if I hadn’t asked a DH faculty member at my university what a dataset actually looked like. He shared a dataset with me, from a project he had completed, that was reassuringly elegant in its simplicity. It was an excel spreadsheet, with six columns of basic data (e.g. year of publication, place of publication, type of publication) that became a very useful model for my own project.
- Savor the rewards. Maybe it’s the type-A in me coming out of the closet after years of unstructured academic research, but the gratification of seeing a spreadsheet full of beautiful data that I had collected felt even better than the satisfaction I experience after filling a page with writing. It’s even more rewarding when that data becomes something – whether that be evidence for your argument, items in a digital archive, or, in my case, a multi-layered map of Edith Holden’s field books.

Of course you don’t always have to build a dataset from scratch. There’s more data out there than you probably expect. Start with government agencies and societies organized around your topic or data need (e.g. The Royal Astronomical Society). In a larger project or with the right resources, you may be able to work with a developer or Computer Science experts to build an algorithm to collect digital data for you.
But for most of us, building a dataset often comes down to manually inputting columns and columns of data, gleaned from digitized or undigitized texts, into spreadsheets. While the work is often monotonous, the results can be invigorating. Here’s a static snapshot of the dynamic map my dataset has helped me create and a little foretaste of a future post:
